
17 Essential Sales KPIs to Track for Better Growth
Sales teams collect data from calls, meetings, proposals, deals, and customer accounts. Yet more data does not always lead to better decisions. The real challenge is knowing which numbers reveal progress and which simply create dashboard clutter. The right sales KPIs help you understand revenue growth, pipeline health, conversion performance, sales productivity, and customer value. They can also expose problems before those problems affect quarterly results. This guide explains the most useful sales KPIs to track, how each metric is calculated, and what the result may tell you. You will also learn how to choose KPIs that match your sales model instead of tracking every available number.
Sales KPIs are measurable indicators connected to specific sales goals. Most businesses should track a focused mix of revenue, pipeline, conversion, productivity, and customer-related KPIs rather than relying on revenue alone.
What Are Sales KPIs?
Sales key performance indicators measure progress toward defined sales objectives. They help managers determine whether current activity is producing useful business outcomes.
A sales KPI should support a decision. For example, win rate can reveal problems with lead quality or sales conversations. Pipeline coverage can show whether the team has enough potential revenue to meet its target.
Sales KPIs vs Sales Metrics
A sales metric records an activity or result. A KPI is a strategically important metric connected to a goal.
Call volume is a sales metric. It becomes a KPI when the business uses it to measure progress toward a target, such as increasing qualified meetings.
Not every number deserves a place on the main dashboard.
Leading vs Lagging Sales Indicators
Leading indicators suggest what may happen next. Examples include lead response time, meetings booked, and qualified pipeline created.
Lagging indicators measure completed outcomes. Revenue, quota attainment, customer churn, and closed deals fall into this category.
In my view, a useful sales dashboard needs both. Leading indicators help you act early, while lagging indicators confirm the final result.
Sales KPIs to Track for Revenue and Growth
Revenue KPIs show whether sales efforts are producing financial growth. They are important, but they should be reviewed alongside pipeline and customer metrics.
1. Total Sales Revenue
Total sales revenue is the income generated from completed sales during a specific period.
Formula: Add the revenue from all closed sales.
A B2B agency that closes five contracts worth $8,000 each records $40,000 in total sales revenue.
Revenue shows the outcome, but it does not explain why performance increased or declined. Other KPIs provide that context.
2. Sales Growth Rate
Sales growth rate measures the percentage change in revenue between two comparable periods.
Formula:
(Current revenue − previous revenue) ÷ previous revenue × 100
Suppose a company increases monthly revenue from $80,000 to $92,000. Its monthly sales growth rate is 15%.
Compare similar periods whenever possible. Seasonal businesses may get misleading results by comparing a busy month with a naturally slower one.
3. Monthly Recurring Revenue
Monthly recurring revenue, commonly called MRR, measures predictable subscription revenue generated each month.
Formula:
Number of active customers × average monthly subscription value
A software company with 200 customers paying $75 per month has an MRR of $15,000.
MRR is most useful for subscription businesses. A company selling one-time projects may gain little value from tracking it.
4. Average Deal Size
Average deal size shows the average revenue generated by each closed sale.
Formula:
Total closed revenue ÷ number of closed deals
If ten deals generate $100,000, the average deal size is $10,000.
I recommend reviewing this KPI by customer segment. Combining small-business and enterprise deals into one average may hide meaningful differences.
Sales Pipeline KPIs to Track
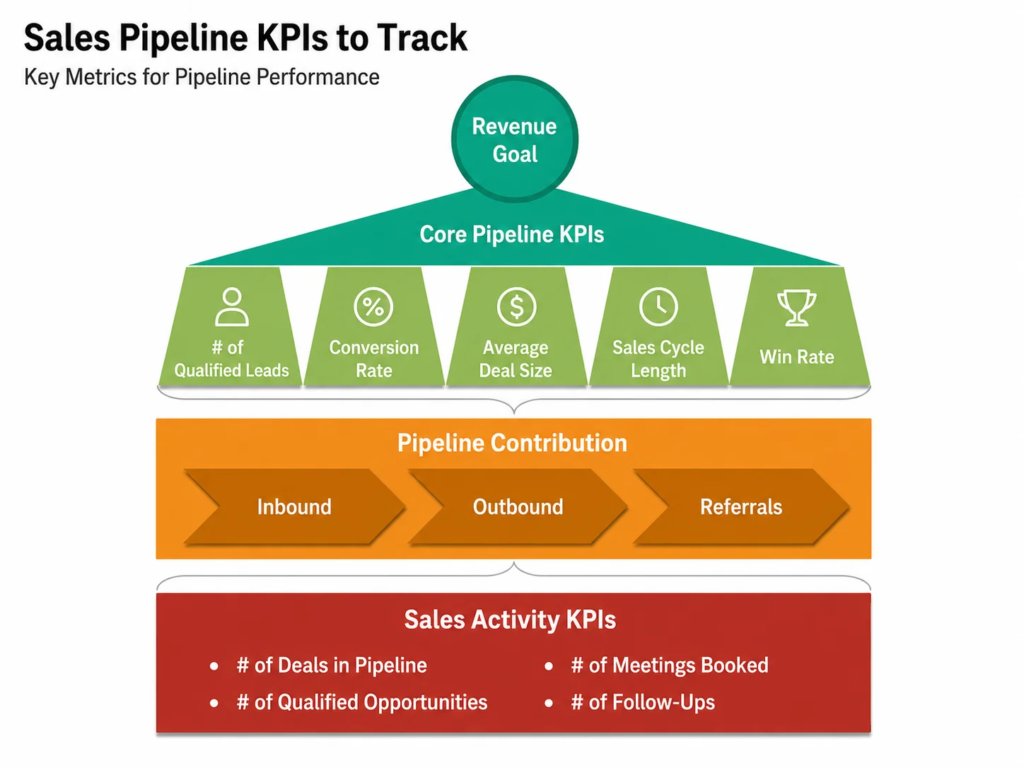
Pipeline KPIs show whether enough qualified opportunities are moving toward a sale. They can expose problems before revenue declines.
5. Lead Conversion Rate
Lead conversion rate measures the percentage of leads that complete a defined action.
Formula:
Converted leads ÷ total leads × 100
The word “converted” must be defined clearly. It could mean becoming a qualified lead, booking a meeting, requesting a proposal, or completing a purchase.
A vague definition makes the result difficult to compare.
6. Sales Win Rate
Sales win rate shows the percentage of closed opportunities that resulted in a sale.
Formula:
Won deals ÷ total closed opportunities × 100
If a sales team closes 40 opportunities and wins 12, its win rate is 30%.
A declining win rate may point to weak qualification, pricing concerns, unsuitable leads, competitive pressure, or poor follow-up.
7. Pipeline Value
Pipeline value represents the combined potential value of all open sales opportunities.
Formula:
Add the estimated value of every active opportunity.
A pipeline containing ten opportunities worth $20,000 each has a total value of $200,000.
However, pipeline value can look stronger than it really is. Outdated opportunities, unrealistic deal values, and inaccurate close dates can inflate the number.
8. Pipeline Coverage Ratio
Pipeline coverage compares the value of the sales pipeline with the revenue target for the same period.
Formula:
Total pipeline value ÷ sales target
A business with a $300,000 pipeline and a $100,000 target has a coverage ratio of 3:1.
That does not guarantee the target will be reached. The required ratio depends on win rate, deal timing, qualification standards, and forecast accuracy.
9. Sales Velocity
Sales velocity estimates how quickly opportunities move through the pipeline and generate revenue.
Formula:
Number of opportunities × average deal size × win rate ÷ average sales-cycle length
The metric combines four important parts of sales performance. Improving any one of them may increase velocity.
For example, a team may generate faster revenue by shortening approval delays instead of chasing more leads.
10. Sales Cycle Length
Sales cycle length measures the average time between the beginning of a sales opportunity and the final decision.
Formula:
Total number of days required to close deals ÷ number of closed deals
A high-ticket sales cycle can improve cash flow and forecasting. Still, speed should not come at the expense of lead qualification or customer fit.
Complex enterprise sales will usually take longer than low-cost ecommerce purchases.
Sales Team Performance Metrics
Team performance KPIs help managers understand productivity, workload, and progress toward assigned targets.
11. Quota Attainment
Quota attainment measures how much of an assigned sales target a representative or team achieved.
Formula:
Actual sales ÷ assigned quota × 100
A representative who generates $90,000 against a $100,000 target reaches 90% quota attainment.
One result should not be judged in isolation. Territory quality, account allocation, experience, and market conditions can affect performance.
12. Revenue per Sales Representative
This KPI calculates the average revenue contribution per sales representative.
Formula:
Total sales revenue ÷ number of sales representatives
If a five-person team generates $500,000, average revenue per representative is $100,000.
Use caution when comparing new hires with experienced team members. Their account access, training stage, and responsibilities may differ significantly.
13. Lead Response Time
Lead response time measures how long it takes a sales representative to respond after a new lead enters the system.
Formula:
Total response time ÷ number of leads contacted
This is a useful leading indicator because delays can reveal poor routing, workload problems, or inconsistent follow-up.
It should be tracked separately from conversion. A fast response is valuable only when the interaction is relevant and helpful.
Customer and Profitability KPIs
Closing a sale is not the end of performance measurement. Customer value, acquisition cost, and retention determine whether growth is sustainable.
14. Customer Acquisition Cost
Customer acquisition cost, or CAC, estimates the average cost of gaining one new customer.
Formula:
Total sales and marketing acquisition costs ÷ new customers acquired
If a business spends $20,000 and gains 100 customers, its CAC is $200.
Use the same cost categories every reporting period. Changing what is included can make comparisons inaccurate.
15. Customer Lifetime Value
Customer lifetime value estimates the total financial value a customer may generate throughout the relationship.
Simple formula:
Average purchase value × purchase frequency × average customer lifespan
CLV is more useful when compared with CAC. A customer may generate strong revenue but still be unprofitable if acquisition and service costs are too high.
16. Customer Retention Rate
Customer retention rate measures the percentage of customers that remain with the business during a defined period.
Formula:
(Ending customers − new customers) ÷ starting customers × 100
This KPI is particularly useful for SaaS, subscription, account-based, and repeat-purchase businesses.
Strong retention may indicate good customer fit, consistent service, and continued product value.
17. Customer Churn Rate
Customer churn rate shows the percentage of customers lost during a reporting period.
Formula:
Customers lost ÷ customers at the beginning of the period × 100
Rising churn may be connected to poor onboarding, pricing concerns, weak support, unmet expectations, or unsuitable customer acquisition.
Churn should be reviewed by customer segment. Losing one major account may matter more than losing several low-value customers.
Sales KPI Comparison Table
| Sales KPI | What It Measures | Basic Formula | Suggested Review |
| Total sales revenue | Income from closed sales | Sum of closed revenue | Monthly |
| Sales growth rate | Revenue change over time | Revenue change ÷ previous revenue | Monthly or quarterly |
| Lead conversion rate | Leads completing a defined action | Converted leads ÷ total leads | Weekly or monthly |
| Sales win rate | Closed opportunities won | Won deals ÷ closed opportunities | Monthly |
| Pipeline coverage | Pipeline value against target | Pipeline value ÷ sales target | Weekly or monthly |
| Sales velocity | Speed of revenue generation | Opportunities × deal size × win rate ÷ cycle length | Monthly |
| Quota attainment | Progress against target | Actual sales ÷ quota | Monthly |
| Customer acquisition cost | Cost of gaining customers | Acquisition costs ÷ new customers | Monthly or quarterly |
| Customer retention rate | Customers retained | Retained customers ÷ starting customers | Monthly or quarterly |
| Customer churn rate | Customers lost | Lost customers ÷ starting customers | Monthly |
How to Choose the Right Sales KPIs
Tracking all 17 KPIs on one dashboard is rarely necessary. Your primary dashboard should contain only the measures that support current sales goals.
Start With the Business Goal
If revenue is below target, review pipeline coverage, win rate, deal size, and sales-cycle length.
When acquisition costs are rising, focus on CAC, conversion rate, customer lifetime value, and retention.
Every core KPI should lead to a possible action.
Consider the Sales Model
A SaaS company may prioritise MRR, churn, retention, CAC, and CLV.
A B2B agency may focus on pipeline coverage, average contract value, win rate, and sales-cycle length.
Ecommerce teams often monitor revenue, conversion rate, acquisition cost, average order value, and repeat purchases.
Keep the Dashboard Focused
I would usually keep the main management dashboard limited to a small group of priority KPIs. Supporting metrics can remain available for deeper analysis.
A focused dashboard makes unusual changes easier to notice and discuss.
Examples of Sales KPIs in Different Businesses
SaaS Company
A SaaS business may track MRR, customer acquisition cost, lifetime value, retention, and churn. Together, these metrics show whether recurring growth is sustainable.
B2B Marketing Agency
An agency may monitor qualified pipeline, proposal win rate, contract value, sales-cycle length, and client retention. These KPIs connect new business activity with long-term account value.
Ecommerce Business
An online retailer may track revenue, website conversion rate, customer acquisition cost, average order value, and repeat-purchase rate.
Real Estate Sales Team
A real estate team may review lead response time, appointment rate, property-viewing conversion, closed deals, and revenue per agent.
Small Accounting Firm
A small accounting firm may prioritise qualified leads, proposal acceptance rate, average client value, acquisition cost, and annual client retention.
How to Build a Sales KPI Dashboard
Start by separating company-level KPIs from individual performance measures. Revenue growth and pipeline coverage belong at the management level. Response time and quota attainment may be reviewed by representative.
Next, set a suitable reporting frequency:
- Review urgent activity and response metrics daily.
- Check pipeline movement and new opportunities weekly.
- Analyse revenue, win rate, quota, and deal size monthly.
- Review retention, churn, and lifetime value over longer periods.
Definitions must remain consistent. If the meaning of a qualified lead changes every month, the trend loses value.
Most importantly, connect each KPI to an action. A falling win rate may require better qualification, coaching, pricing analysis, or proposal improvements.
Common Sales KPI Mistakes
Tracking too many numbers is one of the most common problems. A crowded dashboard can make important changes harder to see.
Another mistake is treating activity as success. More calls and emails do not automatically create stronger results. They matter only when they produce qualified opportunities and revenue.
Poor CRM data can also lead to false conclusions. Missing values, outdated stages, duplicate records, and unrealistic close dates weaken every report.
Avoid treating industry benchmarks as universal standards. Sales performance varies by sector, deal value, market, business maturity, and sales-cycle complexity.
Finally, do not review KPIs without assigning action. Reporting alone does not improve performance.
Frequently Asked Questions
What Are the Most Important Sales KPIs?
The most important sales KPIs usually include revenue, win rate, pipeline coverage, sales-cycle length, quota attainment, CAC, and customer retention. The final selection should match the company’s sales model and goals.
How Many Sales KPIs Should a Business Track?
A business should track a focused set of core KPIs rather than every available metric. Many dashboards work better with five to eight priority indicators supported by additional diagnostic metrics.
What Is the Difference Between a Sales KPI and a Sales Metric?
A sales KPI is a metric directly connected to an important business objective. A regular sales metric may record activity without being important enough to guide management decisions.
How Often Should Sales KPIs Be Reviewed?
Sales KPIs should be reviewed according to how quickly they change and how urgently action is required. Operational metrics may need daily or weekly review, while retention and profitability measures may be reviewed monthly or quarterly.
Which Sales KPIs Should Small Businesses Track?
Small businesses should usually track revenue, lead conversion rate, average deal size, win rate, sales-cycle length, acquisition cost, and customer retention. A simple dashboard is easier to maintain and act on.
What Should a Sales KPI Dashboard Include?
A sales KPI dashboard should include current results, targets, reporting periods, historical trends, and clear ownership. It should also contain a balanced mix of leading and lagging indicators.
Final Thoughts
The best sales KPIs to track are not necessarily the most complicated ones. They are the numbers that clearly show whether sales activity is producing healthy revenue, a reliable pipeline, productive teams, and valuable customers. Choose a focused set, define each formula consistently, and review results on a suitable schedule. A strong dashboard should do more than display performance. It should help you see what needs attention and what action should happen next.